图谱的展示
图的原始数据就是一些节点与一些关系。这些数据可以放在neo4j数据库。
noe4j的一些简单使用:
1.增删改查
//TheMatrix是标签,可以为任意字符
CREATE (TheMatrix:Movie3 {title:'The Matrix', released:1999, tagline:'Welcome to the Real World'})
//一次创建一个关系,两个节点
CREATE (database:Database {name:"Neo4j"})-[r:SAYS]->(message:Message {name:"Hello World!"}) RETURN database, message, r

//删除
MATCH (TheMatrix:Movie3) WHERE TheMatrix.title = 'The Matrix' DELETE  TheMatrix;
MATCH (n) where n.name='unknown' and n.cid is null delete n;

//改
MATCH (TheMatrix:Movie3) WHERE TheMatrix.title = 'The Matrix' SET TheMatrix.title = 'superstar'

//查
//查Movie3节点
MATCH (n:Movie3) RETURN n LIMIT 25
MATCH (n) where n.name='unknown' RETURN n LIMIT 25
MATCH (TheMatrix:Movie3) WHERE TheMatrix.title = 'superstar'  RETURN TheMatrix
MATCH (n:Person) WHERE n.name = 'John' RETURN n LIMIT 25
MATCH (p { name: 'John' }) RETURN p
//查关系为ACTED_IN的
MATCH p=()-[r:ACTED_IN]->() RETURN p LIMIT 25
//查有关系的
MATCH p=()-[r]->() RETURN p LIMIT 10
//查关系John与(from)谁是好朋友
MATCH p=(n:Person{name:'John'})-[r:FRIEND]->()  RETURN p LIMIT 25

//查以某结点为"to"结点的
MATCH p=()-[r]->(n { name: 'care' }) RETURN p LIMIT 10

//类似sql的like,用正则表达式
MATCH (n:Category) WHERE n.name=~'.*owl.*'   RETURN n LIMIT 25

//count的使用
//返回节点数
MATCH (n) RETURN count(*)
//返回关系数
MATCH ()-->() RETURN count(*);

#子查询,找到关系数大于1的,并且关系中有'sameAs'的
match (a)-[r]->(b) with a,b, count(*) as c where c>1
match (a)-[r]->(b)
with a,b,r
where type(r)='sameAs'
return a,b,count(*)

#子查询,找到关系数大于1的,并且关系是一种关系的
match (a)-[r]->(b) with a,b, count(*) as c where c>1
match (a)-[r]->(b)
with a,b,count(distinct type(r)) as ct
where ct=1
return a,b,ct

2.建索引
CREATE CONSTRAINT ON (TheMatrix:Movie3) ASSERT TheMatrix.title IS UNIQUE
然后是这些数据的可视化,先用java把把数据查出来.
pom.xml
<dependency>
    <groupId>org.neo4j.driver</groupId>
    <artifactId>neo4j-java-driver</artifactId>
    <version>4.2.0</version>
</dependency>
java代码,demo:
String url ="bolt://192.168.1.1:7687";
String userName = "neo4j";
String passWord = "neo4j";
// 使用 basic authentication方式创建连接
try {
	Driver driver = GraphDatabase.driver(url, AuthTokens.basic(userName, passWord), Config.builder().withMaxConnectionLifetime(30, TimeUnit.MINUTES).withMaxConnectionPoolSize(50).withConnectionAcquisitionTimeout(2, TimeUnit.MINUTES).build());
	Session session = driver.session();
	String cond="MATCH (n:Person) RETURN n LIMIT 25";
	List<Object> rst= session.run(cond).list(r -> r.toString());
	System.out.println(rst);


	try (Session createSession = driver.session()) {
		String greeting = createSession
				.writeTransaction(new TransactionWork<String>() {
					@Override
					public String execute(Transaction tx) {
						Result result = tx
								.run("CREATE (john:Person {name: 'John'})\n" +
										"CREATE (joe:Person {name: 'Joe'})\n" +
										"CREATE (steve:Person {name: 'Steve'})\n" +
										"CREATE (sara:Person {name: 'Sara'})\n" +
										"CREATE (maria:Person {name: 'Maria'})\n" +
										"CREATE (john)-[:FRIEND]->(joe)-[:FRIEND]->(steve)\n" +
										"CREATE (john)-[:FRIEND]->(sara)-[:FRIEND]->(maria)");
						//return result.single().get(0).asString();
						return "";
					}
				});
		System.out.println(greeting);
	}
	session.close();


} catch (Exception e) {
    log.error("图数据库连接异常",e);

}
前端显示框架与方法:
1.echart

2.highchart

3.vis.js
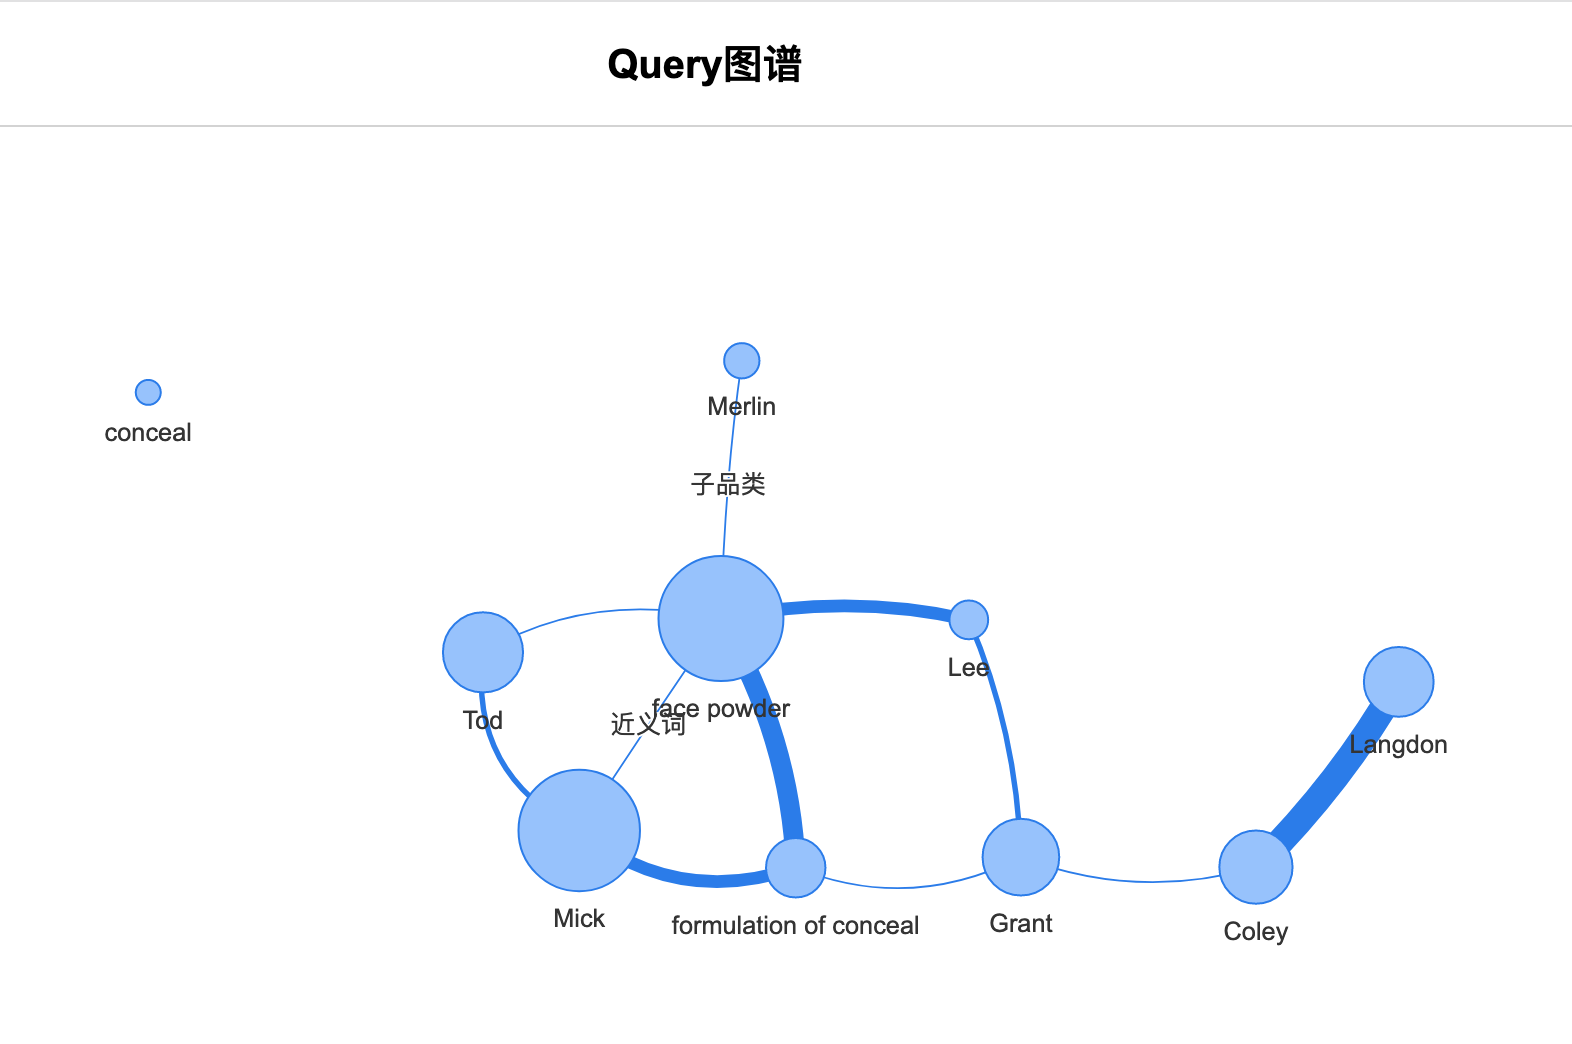
这个vis.js的代码:
<!DOCTYPE html>
<html>
  <head>
    <title>Vis Network | Data | Custom Scaling</title>

    <style type="text/css">
      html,
      body {
        font: 10pt arial;
      }
      #mynetwork {
        width: 100%;
        height: 600px;
        border: 1px solid lightgray;
      }
    </style>

    <script
      type="text/javascript"
      src="vis-network.js"></script>

    <script type="text/javascript">
      var nodes = null;
      var edges = null;
      var network = null;

      function draw() {
        // create people.
        // value corresponds with the age of the person
        nodes = [
          { id: 1, value: 2, label: "conceal" },
          { id: 2, value: 31, label: "face powder" },
          { id: 3, value: 12, label: "formulation of conceal" },
          { id: 4, value: 16, label: "Coley" },
          { id: 5, value: 17, label: "Grant" },
          { id: 6, value: 15, label: "Langdon" },
          { id: 7, value: 6, label: "Lee" },
          { id: 8, value: 5, label: "Merlin" },
          { id: 9, value: 30, label: "Mick" },
          { id: 10, value: 18, label: "Tod" },
        ];

        // create connections between people
        // value corresponds with the amount of contact between two people
        edges = [
          { from: 2, to: 8, value: 1 ,label:"子品类"},
          { from: 2, to: 9, value: 1 ,label:"近义词"},
          { from: 2, to: 10, value: 1 },
          { from: 4, to: 6, value: 8 },
          { from: 5, to: 7, value: 2 },
          { from: 4, to: 5, value: 1 },
          { from: 9, to: 10, value: 2 },
          { from: 2, to: 3, value: 6 },
          { from: 3, to: 9, value: 4 },
          { from: 5, to: 3, value: 1 },
          { from: 2, to: 7, value: 4 },
        ];

        // Instantiate our network object.
        var container = document.getElementById("mynetwork");
        var data = {
          nodes: nodes,
          edges: edges,
        };
        var options = {
          nodes: {
            shape: "dot",
            scaling: {
              customScalingFunction: function (min, max, total, value) {
                return value / total;
              },
              min: 5,
              max: 150,
            },
          },
        };
        network = new vis.Network(container, data, options);
      }
    </script>
  </head>
  <body onload="draw()">
    <h2 style="text-align: center;">Query图谱</h2>
    <div id="mynetwork"></div>
  </body>
</html>
还有其它的方案,比如用d3.js。但这个框架基于node.js,对npm等不熟的我只能放弃。
比如这个example (https://observablehq.com/@d3/force-directed-graph)效果不错,但我没运行起来。
但可以写些简单的demo,如:
<html>
<head>
	<script src="https://d3js.org/d3.v6.min.js"></script>
</head>
<body>
<div class="chart"></div>
<p>Credit: <a href="https://observablehq.com/@d3/force-directed-graph">Force-Directed Graph by D3</a></p>
<p>Credit: <a href="https://observablehq.com/@d3/force-directed-graph">Force-Directed Graph by D3</a></p>
<p>Credit: <a href="https://observablehq.com/@d3/force-directed-graph">Force-Directed Graph by D3</a></p>
<p>Credit: <a href="https://observablehq.com/@d3/force-directed-graph">Force-Directed Graph by D3</a></p>


<svg width="100%" height="20%" version="1.1"
xmlns="http://www.w3.org/2000/svg">

<circle cx="100" cy="50" r="40" stroke="black"
stroke-width="2" fill="red"/>
</svg>


<script type="module">
	/*
var paragraphs = document.getElementsByTagName("p");
for (var i = 0; i < paragraphs.length; i++) {
  var paragraph = paragraphs.item(i);
  paragraph.style.setProperty("color", "blue", null);
}
*/
//d3.selectAll("p").style("color", "blue");
/*
d3.selectAll("p").style("color", function() {
  return "hsl(" + Math.random() * 360 + ",100%,50%)";
});

d3.selectAll("p").style("color", function(d, i) {
  return i % 2 ? "#fff" : "#eee";
});

d3.selectAll("p")
  .data([4, 8, 15, 16, 23, 42])
    .style("font-size", function(d) { return d + "px"; });

d3.select("body")
  .selectAll("p")
  .data([4, 8, 15, 16, 23, 42])
  .enter().append("p")
    .text(function(d) { return "I’m number " + d + "!"; });

var p = d3.select("body")
  .selectAll("p")
  .data([4, 8, 15, 16, 23, 42])
    .text(function(d) { return d; });
p.enter().append("p")
    .text(function(d) { return d; });
// Exit…
p.exit().remove();

d3.select("body").transition().style("background-color", "#089458");
*/


d3.selectAll("circle").transition()
    .duration(750)
    .delay(function(d, i) { return i * 10; })
    .attr("r", function(d) {  return Math.sqrt(100); });


function a(){
  const div = document.createElement("div");
  div.innerHTML = "Hello, world!";
  //alert("in");
  return div;
 }
 let adiv=a();
 document.body.appendChild(adiv);

let node=d3.create("span")
    .style("color", "white")
    .style("background-color", "black")
    .html("Hello, world!")
    .node();
document.body.appendChild(node);


var data = [4, 8, 15, 16, 23, 42];
function b(){
  // Create an empty (detached) chart container.
  const div = d3.create("div");

  // Apply some styles to the chart container.
  div.style("font", "10px sans-serif");
  div.style("text-align", "right");
  div.style("color", "white");

  // Define the initial (empty) selection for the bars.
  const bar = div.selectAll("div");

  // Bind this selection to the data (computing enter, update and exit).
  const barUpdate = bar.data(data);

  // Join the selection and the data, appending the entering bars.
  const barNew = barUpdate.join("div");

  // Apply some styles to the bars.
  barNew.style("background", "steelblue");
  barNew.style("padding", "3px");
  barNew.style("margin", "1px");

  // Set the width as a function of data.
  barNew.style("width", d => `${d * 10}px`);

  // Set the text of each bar as the data.
  barNew.text(d => d);

  // Return the chart container.
  return div.node();
}
document.body.appendChild(b());
</script>

</body>
</html>
<!DOCTYPE html>
<html>
<head>
<title>Vis Network | Data | Custom Scaling</title>
<style type="text/css">
html,
body {
font: 10pt arial;
}
#mynetwork {
width: 100%;
height: 600px;
border: 1px solid lightgray;
}
</style>
<script
type="text/javascript"
src="vis-network.js"></script>
<script type="text/javascript">
var nodes = null;
var edges = null;
var network = null;
function draw() {
// create people.
// value corresponds with the age of the person
nodes = [
{ id: 1, value: 2, label: "conceal" },
{ id: 2, value: 31, label: "face powder" },
{ id: 3, value: 12, label: "formulation of conceal" },
{ id: 4, value: 16, label: "Coley" },
{ id: 5, value: 17, label: "Grant" },
{ id: 6, value: 15, label: "Langdon" },
{ id: 7, value: 6, label: "Lee" },
{ id: 8, value: 5, label: "Merlin" },
{ id: 9, value: 30, label: "Mick" },
{ id: 10, value: 18, label: "Tod" },
];
// create connections between people
// value corresponds with the amount of contact between two people
edges = [
{ from: 2, to: 8, value: 1 ,label:"子品类"},
{ from: 2, to: 9, value: 1 ,label:"近义词"},
{ from: 2, to: 10, value: 1 },
{ from: 4, to: 6, value: 8 },
{ from: 5, to: 7, value: 2 },
{ from: 4, to: 5, value: 1 },
{ from: 9, to: 10, value: 2 },
{ from: 2, to: 3, value: 6 },
{ from: 3, to: 9, value: 4 },
{ from: 5, to: 3, value: 1 },
{ from: 2, to: 7, value: 4 },
];
// Instantiate our network object.
var container = document.getElementById("mynetwork");
var data = {
nodes: nodes,
edges: edges,
};
var options = {
nodes: {
shape: "dot",
scaling: {
customScalingFunction: function (min, max, total, value) {
return value / total;
},
min: 5,
max: 150,
},
},
};
network = new vis.Network(container, data, options);
}
</script>
</head>
<body onload="draw()">
<h2 style="text-align: center;">Query图谱</h2>
<div id="mynetwork"></div>
</body>
</html>
相关阅读
评论:
↓ 广告开始-头部带绿为生活 ↓
↑ 广告结束-尾部支持多点击 ↑